Joel N. Myers Weather
Center at Penn State
 |
Ever want a tour
of the Myers Weather Center at Penn
State? If you haven't had the chance,
The Penn Stater editor Tina Hay describes
her visit to the Myers Weather Center and to
the Weather World studio during Parents and Families
Weekend 2009.
Read "Penn
State's Fancy Weather Station."
|
Atmospheric Stability

|
The stability of the
atmosphere depends upon how temperature
changes as you move up from the ground.
First, however, we need to learn some
basics. Rising air always cools, and,
conversely, sinking air always warms. This
type of temperature change, which is caused
simply by ascent or descent in the
atmosphere, is called adiabatic cooling or
warming. When air moves vertically, its
pressure changes. Since the atmospheric
pressure always decreases with height,
sinking air will compress as its pressure
increases. Like the compressed air at the
bottom of a bicycle pump, sinking air in the
atmosphere warms. The converse is true for
the cooling of rising air in the atmosphere.
The exact rate of temperature change for
vertically moving air depends on whether or
not a cloud is forming. In the absence of
clouds, rising air cools at the rate of 5.5
degrees Fahrenheit for every thousand feet
of ascent. Under similar conditions, sinking
air will warm at 5.5 degrees for every
thousand feet of descent. In the presence of
clouds, the rate of adiabatic temperature
change is closer to 3 or 4 degrees for every
thousand feet of vertical displacement.
Since meteorologists
usually talk about an unstable atmosphere
with respect to thunderstorms and other
inclement weather, we should assume that
there are clouds forming in the atmosphere.
If the temperature falls slowly or rises
with height (in other words, if the
temperature falls more slowly than 3 or 4
degrees every thousand feet), the atmosphere
is said to be stable. Air moving upward will
find itself colder than its environment and
will sink back toward the ground. Vertical
currents are suppressed in a stable
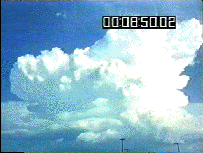
atmosphere. The first picture shows a
stable atmosphere. Click the image for
a brief cloud video.
If the temperature falls rapidly with
height (more rapidly than 3 or 4 degrees
every thousand feet), the atmosphere is
unstable. Air moving upward will find itself
warmer than the air around it. The
upward-moving air will be buoyant and will
therefore continue to rise. Vertical
currents are encouraged and will accelerate
in an unstable atmosphere. The second
picture shows an unstable atmosphere.
Click the image for a brief cloud video.
Atmospheric stability greatly affects the
weather. Precipitation falling from a stable
atmosphere typically affects a large region
and falls with nearly steady intensity ( an
all-day rain or snow). However, localized
showers and thunderstorms with rapidly
varying rainfall rates indicate that the
atmosphere is unstable.
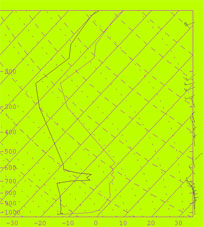
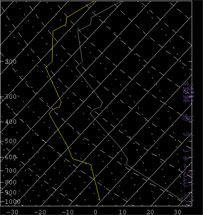
To help
meteorologists determine the stability of
the atmosphere, hundreds of weather balloons
all over the world are launched every twelve
hours. They measure temperatures and other
meteorological quantities at various heights
above the ground. The temperature at a given
location is then organized in graphical form
on a Skew-T diagram. (T
stands for temperature,
skew
just means that temperature lines on the
graph are skewed from being oriented
vertically). Meteorologists can then look at
temperature profiles (temperatures
throughout the lowest 10 miles of the
atmosphere) provided by the Skew-T to
diagnose atmospheric stability.
The green Skew-T
represents a stable atmosphere while the
black Skew-T represents an unstable
atmosphere.
|